> ## Documentation Index
> Fetch the complete documentation index at: https://docs.tracenyx.ai/llms.txt
> Use this file to discover all available pages before exploring further.
# Quickstart
> Install Nyx on your Kubernetes cluster and see live network traffic in the dashboard — in about ten minutes.
This guide gets Nyx running on a Linux Kubernetes cluster and shows you live traffic in the dashboard. It doesn't cover writing policies — for the full hands-on path, head to the tutorial once you're set up.
The [Nyx tutorial](https://github.com/tracenyx/nyx-demo) is the guided, hands-on path: it walks through writing real policies against a sample app, working through audit mode, and running attack simulations. This Quickstart just gets Nyx installed and observing. Start here, then move to the tutorial.
## Prerequisites
Before you start, you'll need:
* An AMD64 Linux Kubernetes cluster with a kernel of 5.15 or newer (for eBPF/TC enforcement) — AKS, EKS, GKE, or self-managed
* `kubectl` configured for that cluster
* Helm 3.8 or newer
Windows nodes are supported through a separate chart — see [Installation](/installation) for the Windows path.
Sign up at [app.tracenyx.ai](https://app.tracenyx.ai). You'll receive a magic link by email — follow it and set a password.
Once you're in, the dashboard shows your personal **install command**, pre-filled with your Scout key. If your cluster has Windows nodes, select the Windows nodes option to get the additional Windows install command alongside it.
Copy the install command from your dashboard and run it. It looks like this:
```bash theme={null}
helm install nyx \
oci://tracenyxcharts.azurecr.io/helm/nyx \
--version 0.1.0 \
--namespace nyx-system \
--create-namespace \
--set global.scout.key= \
--set global.image.registry= \
--set global.image.pullUsername= \
--set global.image.pullPassword=
```
Your dashboard generates this command fully populated with your Scout key and image pull credentials. Copy it from there rather than assembling it by hand — the credentials are unique to your account.
What the flags do:
* `oci://tracenyxcharts.azurecr.io/helm/nyx` — the Nyx Helm chart, pulled from the public Tracenyx registry
* `--namespace nyx-system --create-namespace` — Nyx's components run in their own namespace
* `global.scout.key` — your Scout license key; binds this cluster to your account
* `global.image.registry` with `pullUsername` / `pullPassword` — credentials for pulling the Nyx container images
This installs two components: **nyx-agent**, a DaemonSet that is the kernel-native enforcement engine and runs one pod per node, and **nyx-gatekeeper**, the admission webhook.
Check that everything came up:
```bash theme={null}
kubectl get pods -n nyx-system
```
You should see one `nyx-agent` pod per node and one `nyx-gatekeeper` pod:
```
NAME READY STATUS RESTARTS AGE
nyx-agent-7d9f2 1/1 Running 0 40s
nyx-agent-x4k8p 1/1 Running 0 40s
nyx-gatekeeper-6c5b9d4f7-w2lqz 1/1 Running 0 40s
```
Confirm the CRDs registered:
```bash theme={null}
kubectl get crds | grep nyx.tracenyx.io
```
```
nyxclusternetworkpolicies.nyx.tracenyx.io
nyxnetworkpolicies.nyx.tracenyx.io
```
Nyx's admission webhook needs to recognise your kubectl user so it can authorise policies you apply from the command line. The dashboard prompts you for this on first login — you can also find it later under **Settings → My Account**.
Find your Kubernetes username:
```bash theme={null}
kubectl auth whoami -o jsonpath='{.status.userInfo.username}'
```
Paste the result into the dashboard and confirm. Nyx binds that identity to your account — from this point, applying policies works the same whether you use `kubectl` or the dashboard, and both show up under the same identity in the audit log.
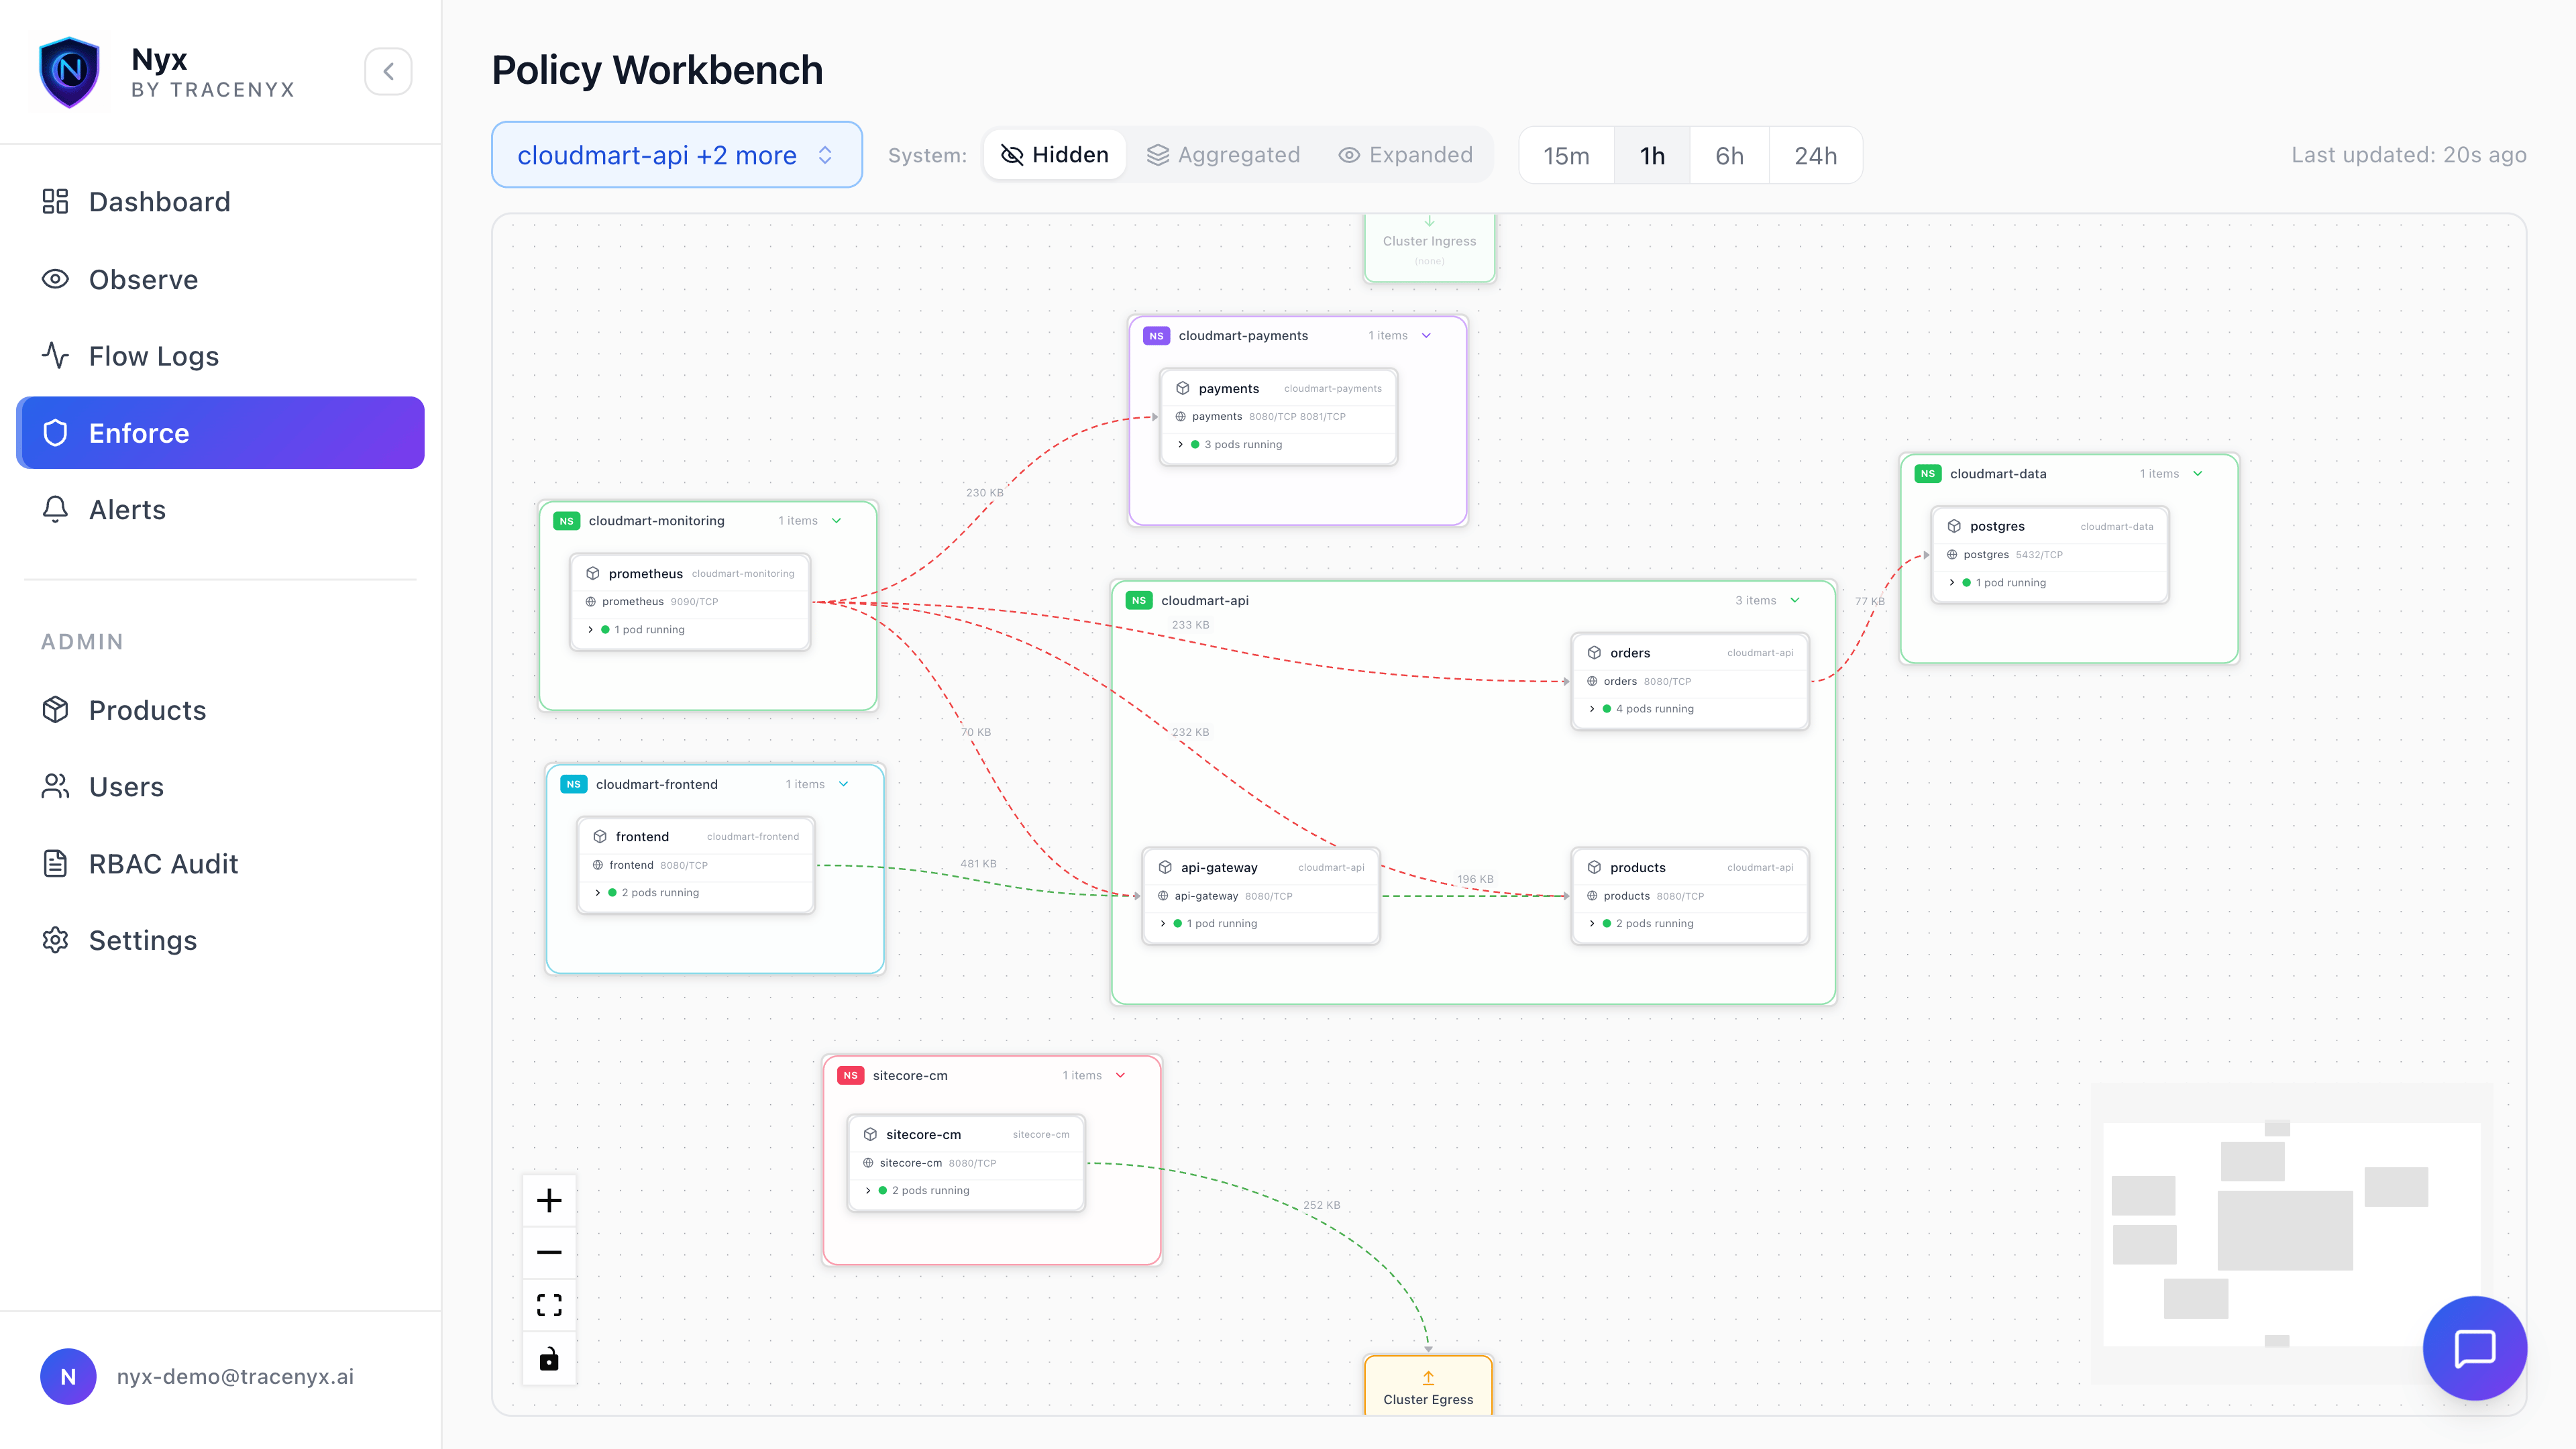
Open the dashboard and go to the **Traffic Map**. Nyx is now watching every flow in your cluster and rendering it live.
Nothing is blocked yet — you haven't applied any policies. This is Nyx in its observing state: full visibility, zero enforcement. It's the right place to start, because you can understand your real traffic before you write a single rule.
 ## Next steps
You've got Nyx installed and observing. Here's where to go next:
The full hands-on path — write real policies against a sample app, work through audit mode, and run attack simulations.
The mental model behind Nyx: tiers, priority bands, and enforcement modes.
The full CRD schema for namespace-scoped policies.
Workload identity and intra-namespace deny — production best practices.
## Next steps
You've got Nyx installed and observing. Here's where to go next:
The full hands-on path — write real policies against a sample app, work through audit mode, and run attack simulations.
The mental model behind Nyx: tiers, priority bands, and enforcement modes.
The full CRD schema for namespace-scoped policies.
Workload identity and intra-namespace deny — production best practices.